The coach feature in myTRIBUS serves as a powerful analytical tool designed to provide users with insights derived from Multiple Listing Service (MLS) data. This feature enables agents and brokerages to benchmark their performance against industry standards, offering a clear perspective on how they are faring in the competitive real estate market. By leveraging real-time data, users can identify trends, evaluate their sales effectiveness, and make informed decisions to enhance their business strategies. The comparative analysis not only highlights individual achievements but also reveals areas for potential growth, ensuring that agents and brokerages remain competitive and responsive to market dynamics.
Note: This feature is only for the premium version of myTRIBUS
Step 1: Login to myTRIBUS
Step 2: Select "coach" from the left-hand side menu
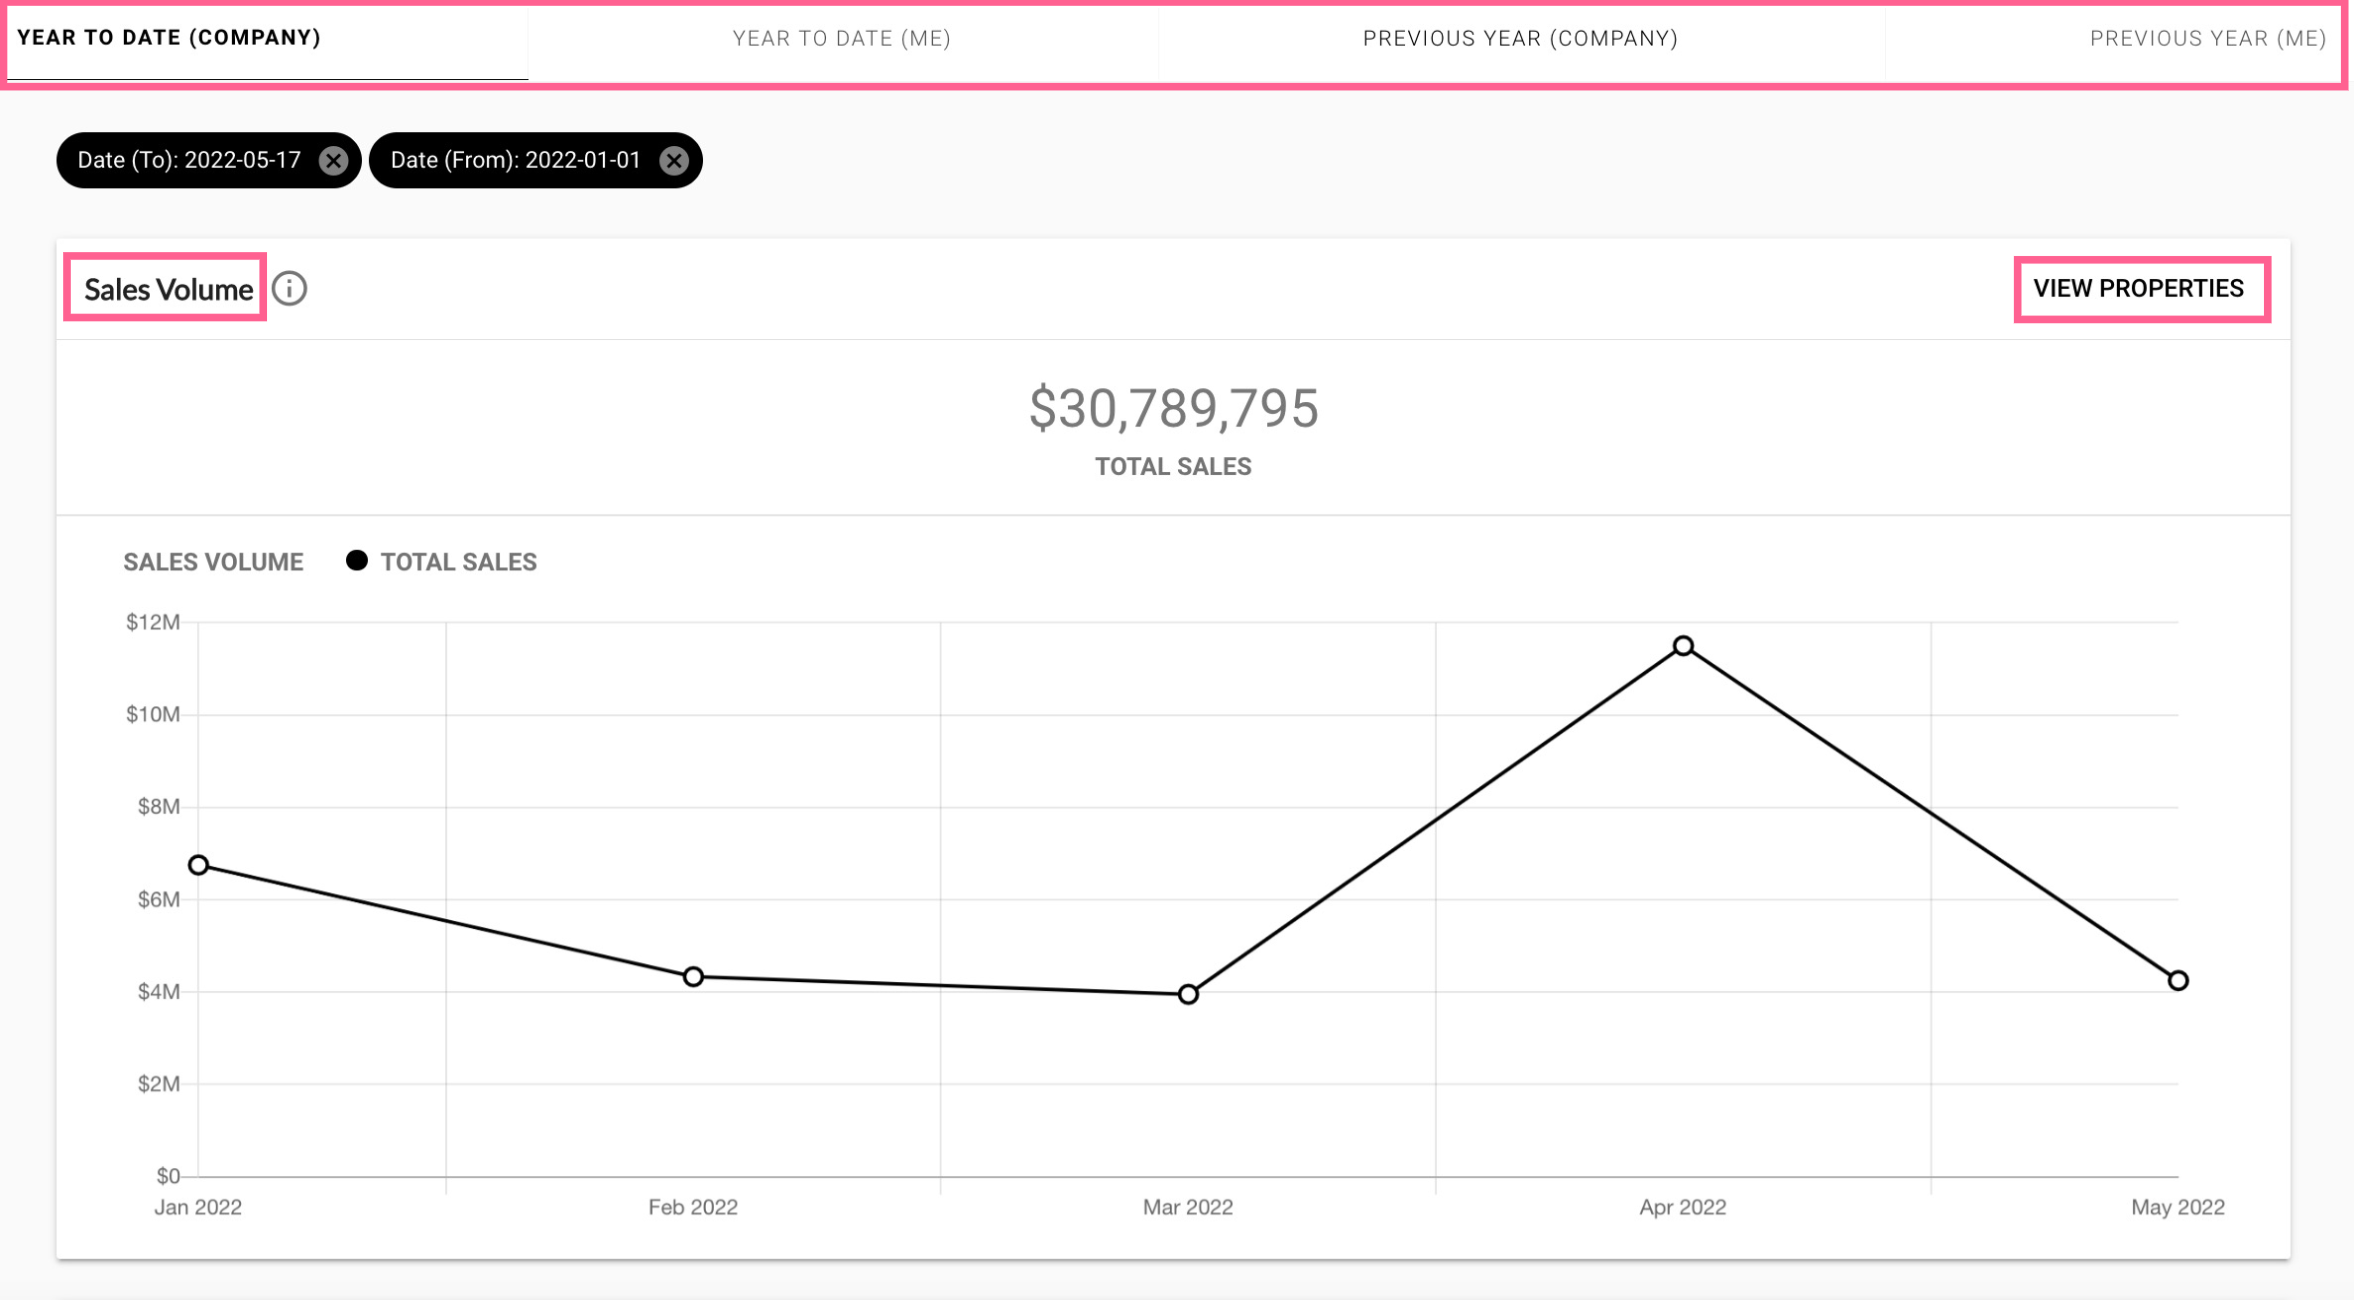
You will see tabs at the top of the page that allow you to sort by:
- Year to date: This option enables you to analyze your performance from the beginning of the current year to the present date. It provides a snapshot of your progress, facilitating a comparison with your goals and previous performance within this timeframe.
- Previous year: Selecting this option allows you to review your performance for the same period in the prior year. This historical perspective is invaluable for understanding trends over time and assessing how your business has evolved in response to market changes.
The first graph you will see is a sales volume graph that allows you to keep track of your total sales. This visual representation of your sales data offers a clear and concise overview of your performance, making it easier to spot patterns and fluctuations in your sales volume. You can even use the "view properties" button to access a detailed list of the properties that are being counted towards the data, giving you insights into which listings have contributed most significantly to your sales figures. This feature not only aids in recognizing your best-performing properties but also helps in strategizing for future listings based on historical success.
Note: All data for coach is pulled in from the MLS
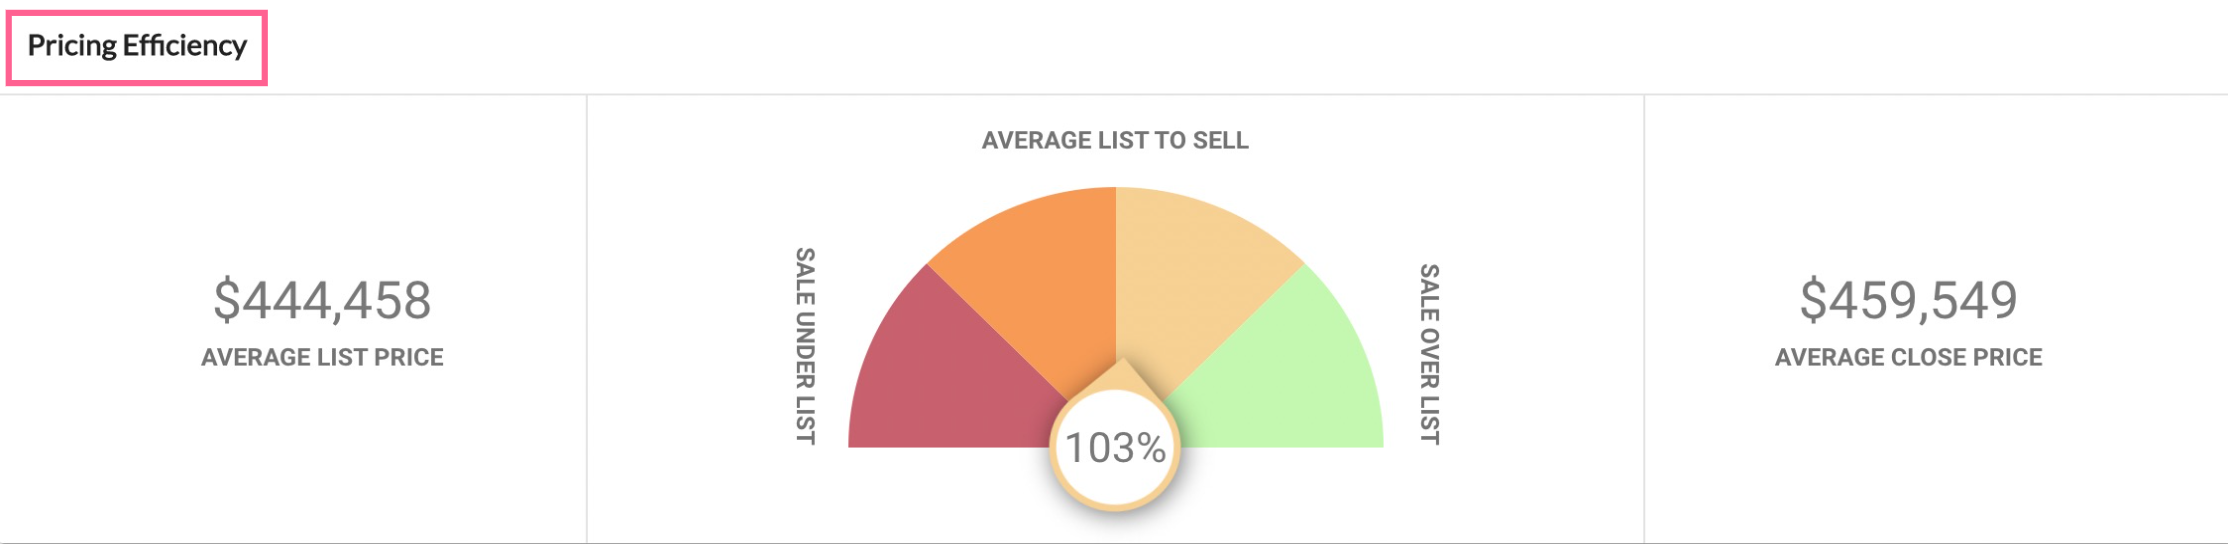
Next, you will see a pricing efficiency graph that allows you to see if you are overselling or underselling in comparison to the average list and close prices. This graph is a crucial tool for evaluating your pricing strategy within the current market conditions. By comparing your listing prices against the average prices achieved in the market, you can identify whether you are pricing your properties competitively or if adjustments are necessary.
If the graph indicates that you are consistently selling properties below the average close price, it may suggest that you are undervaluing your listings, potentially missing out on higher revenue opportunities. Conversely, if your properties are consistently closing above the average list price, this may indicate that your pricing strategy is effective, and you are maximizing your sales potential.
This visual representation not only helps you assess your current pricing tactics but also enables you to make informed adjustments to your strategies. By understanding your pricing efficiency relative to market averages, you can enhance your negotiating power and ensure that you remain competitive in attracting buyers. Additionally, this insight can guide you in determining the appropriate pricing for future listings, ultimately leading to improved sales outcomes and business growth.
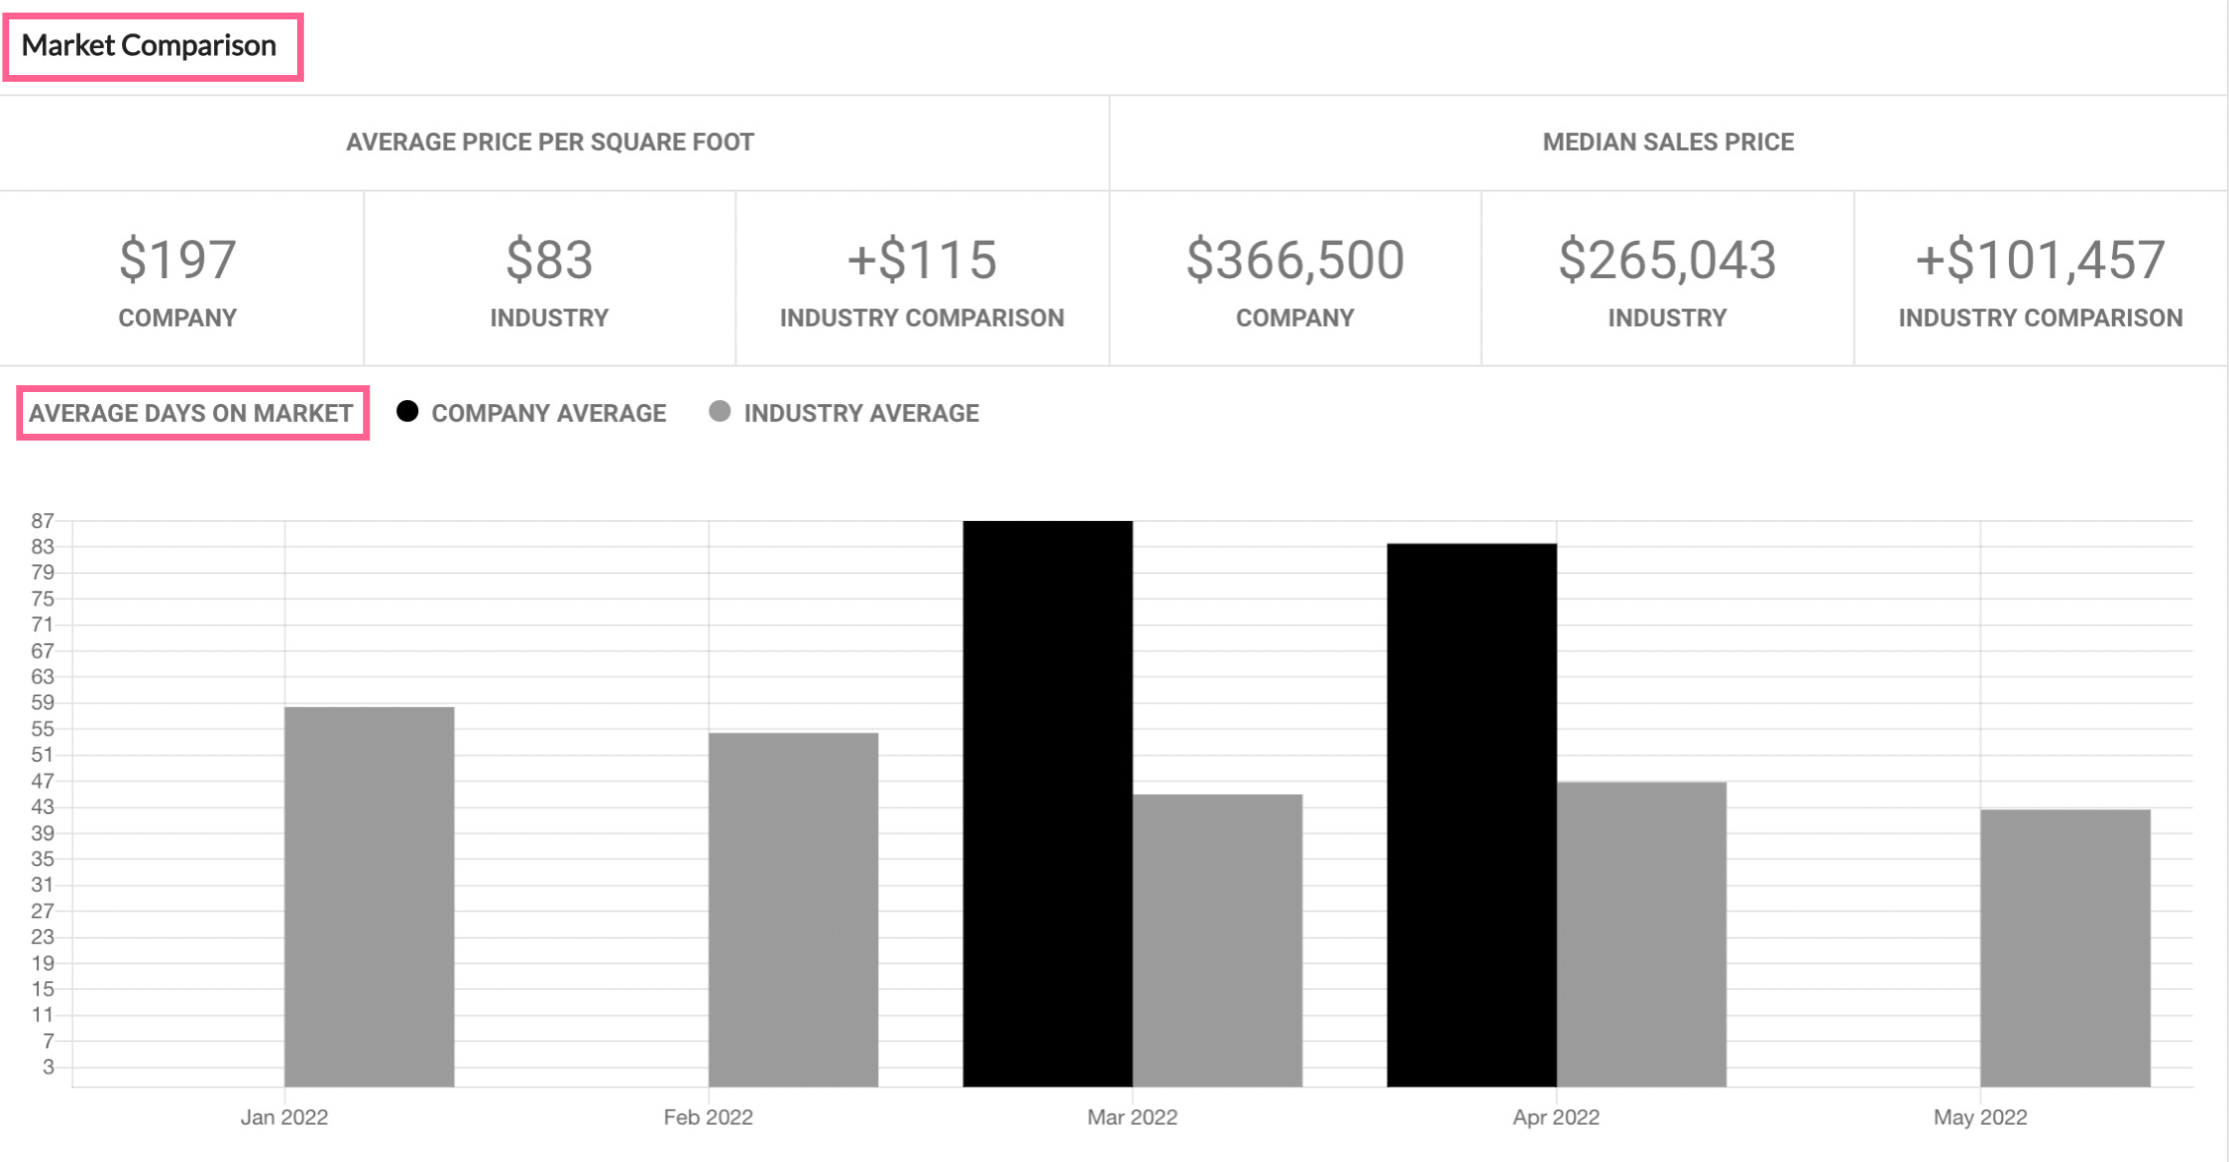
Then you will see a market comparison graph that illustrates the average days on market for your listings in relation to the industry average. This graph is a vital tool for understanding how quickly your properties are selling compared to the broader market. A shorter average days on market may indicate strong demand for your listings, while longer durations might suggest a need to evaluate your marketing strategies or pricing tactics. By analyzing this data, you can gain insights into market trends and adjust your approach to ensure your properties are positioned competitively.
In addition to the average days on market, you will also find a pricing comparison section that analyzes your average price per square foot alongside the industry average. This metric is essential for assessing the value of your properties relative to similar listings in the market. A higher average price per square foot can indicate that your properties are perceived as more desirable or of higher quality, while a lower figure may warrant a reassessment of your pricing strategy.
Furthermore, the comparison of the median sales price against the industry average offers additional context to your pricing decisions. Understanding where your median sales price stands in relation to the market can help you identify whether your listings are priced competitively or if there is room for adjustment. By leveraging these insights, you can refine your pricing strategies, enhance your market positioning, and ultimately drive better sales outcomes.
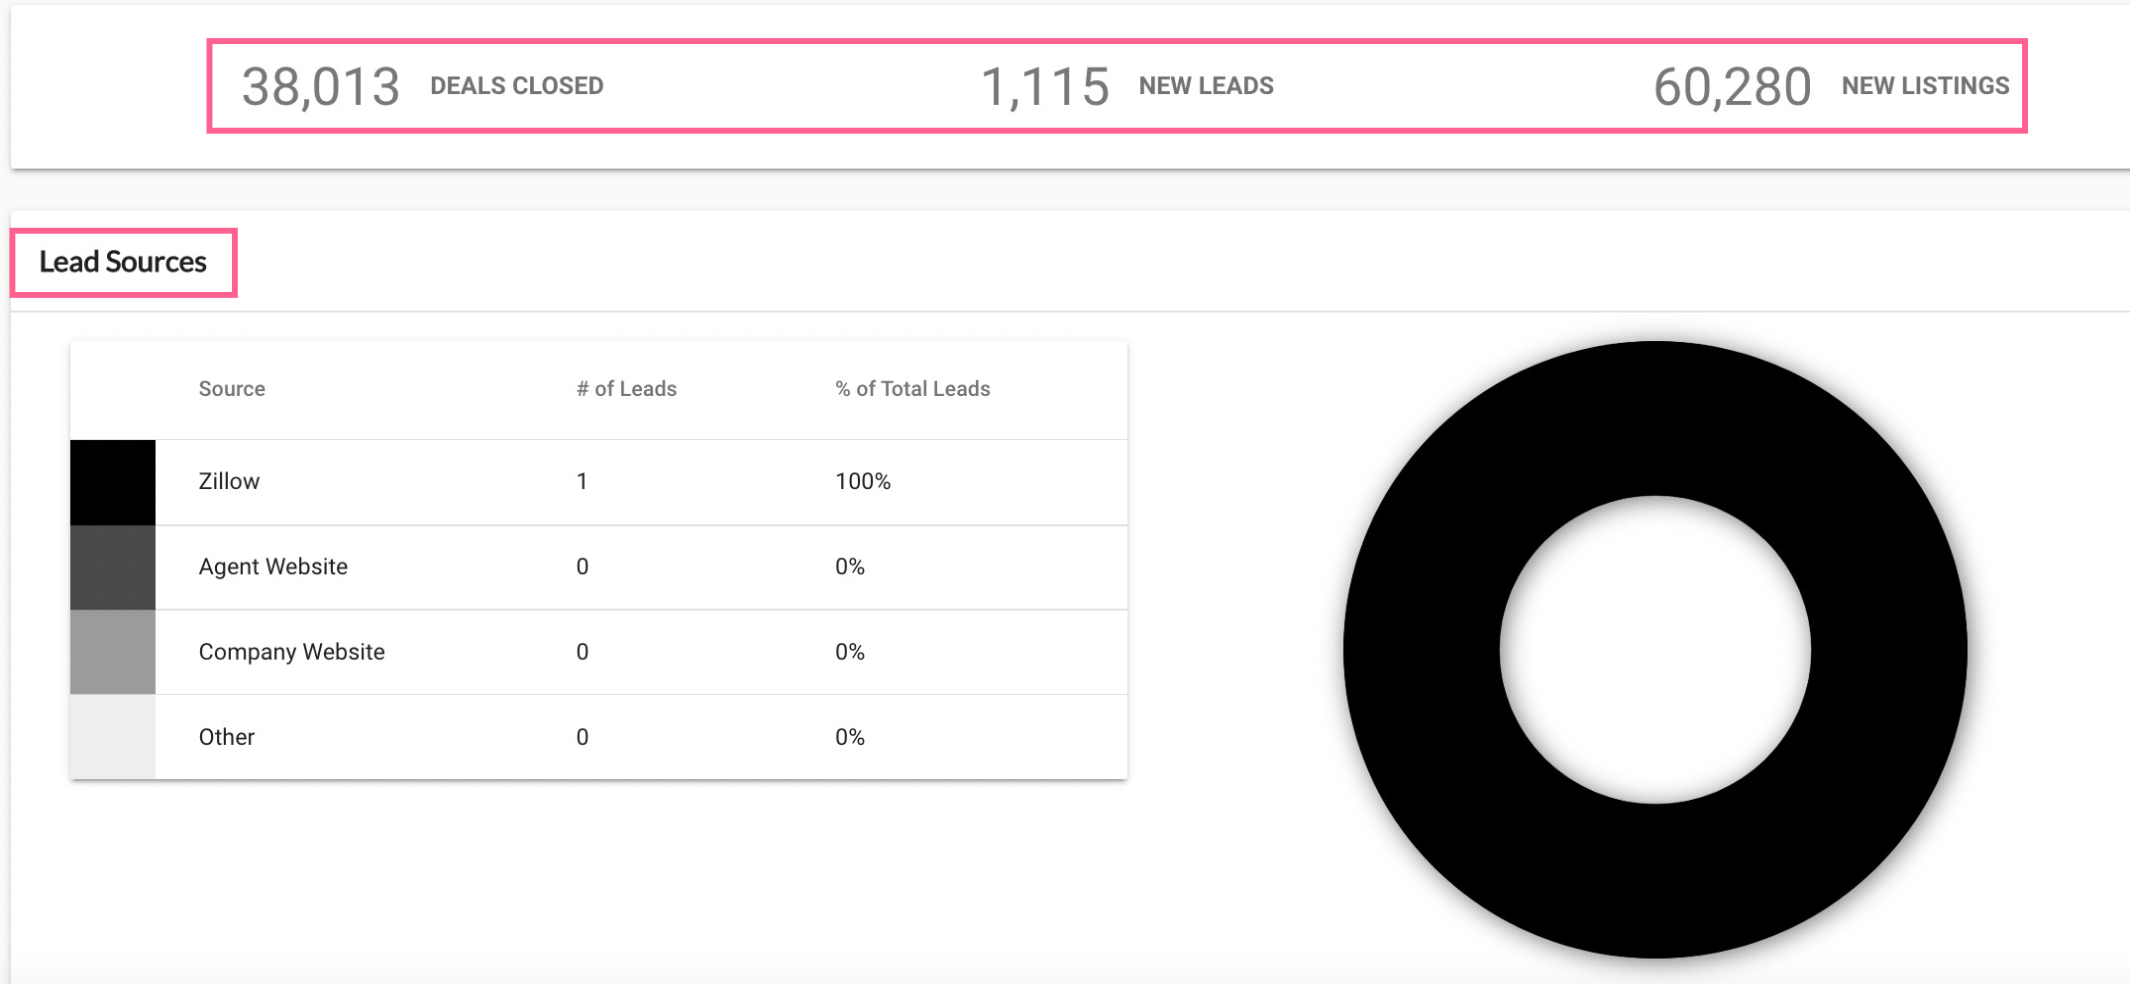
The last graph provides a comprehensive overview of your business performance by displaying key metrics that are crucial for evaluating your success in the real estate market. It includes:
- How many deals were closed: This metric reflects the total number of successful transactions you have completed within the selected timeframe. Analyzing this data helps you understand your closing effectiveness and identify patterns in your sales performance.
- How many new leads have been obtained: This figure indicates the number of potential clients who have expressed interest in your services or properties. Tracking new leads is essential for assessing your marketing efforts and determining the effectiveness of your outreach strategies.
- How many new listings you have on the MLS: This metric shows the total number of properties you have recently listed on the Multiple Listing Service. Keeping an eye on your new listings is vital for understanding your inventory levels and ensuring that you are actively engaging with the market.
- The sources of your leads: This part of the graph breaks down where your leads are coming from, whether it's through referrals, social media, open houses, or other marketing channels. Knowing the sources of your leads allows you to refine your marketing strategies and focus on the most effective channels for generating new business.
By reviewing these metrics, you can gain valuable insights into your overall performance, identify areas for improvement, and make data-driven decisions to enhance your real estate business strategies.